Module 1 · Orient

Module quiz

12 items drawn at random from a bank of 12 · pass mark 75% · unlimited retakes

1. A colleague on the Favorite KPIs tab says they can’t find deep drills anywhere. What do you tell them?

2. One bar sits above its purple line but below its white line, and its value is printed in red. What does that tell you?
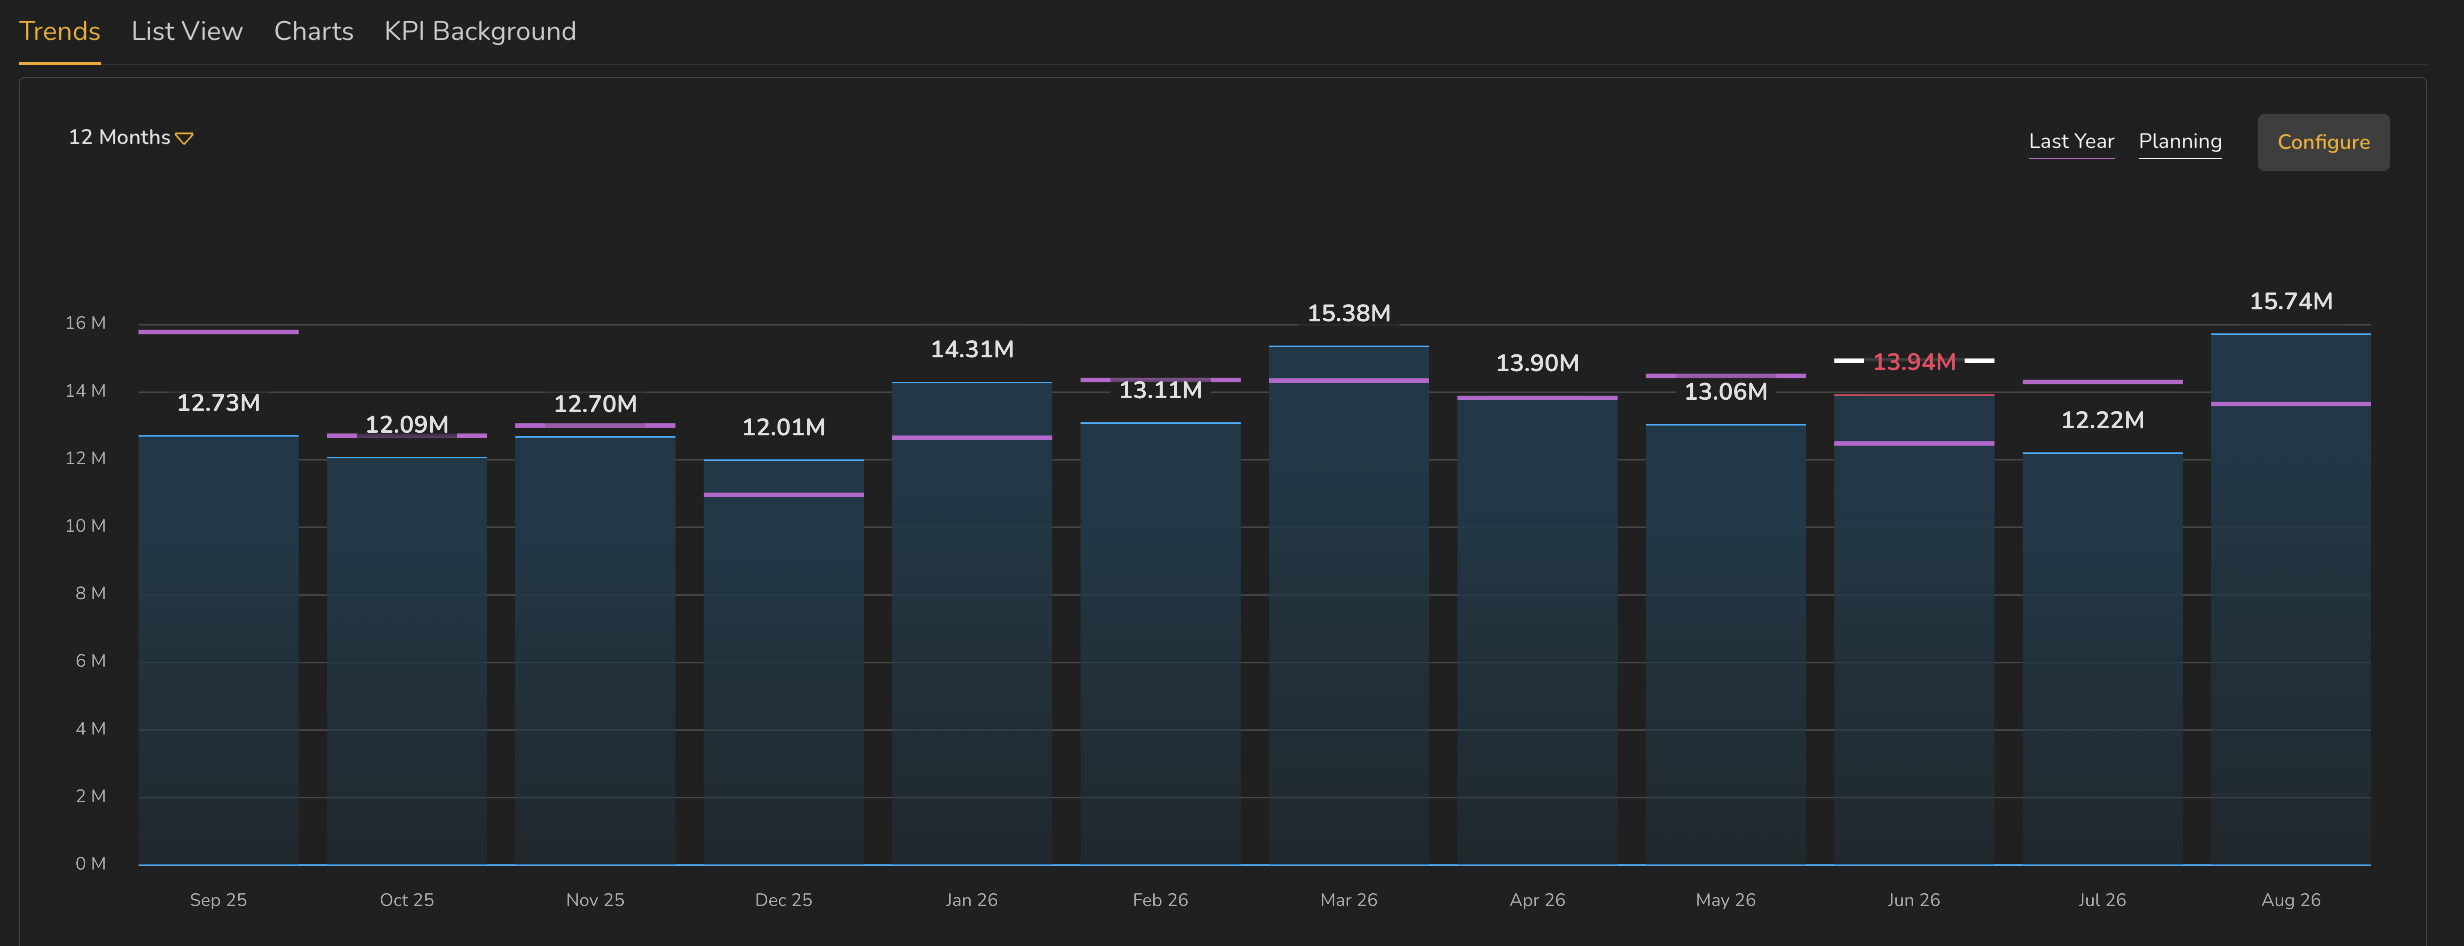
A twelve-month bar chart. Most monthly values are printed in white above their bars; one, 13.94M, is printed in red where a white plan line sits above the bar.

3. You need this KPI for a board pack due in an hour. What do you do?
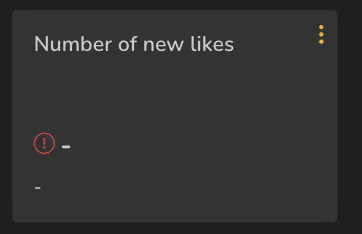
A KPI tile titled Number of new likes showing a red exclamation mark and dashes in place of a value and trend.

4. You need to check whether an integration has stopped delivering data. Which area do you open?
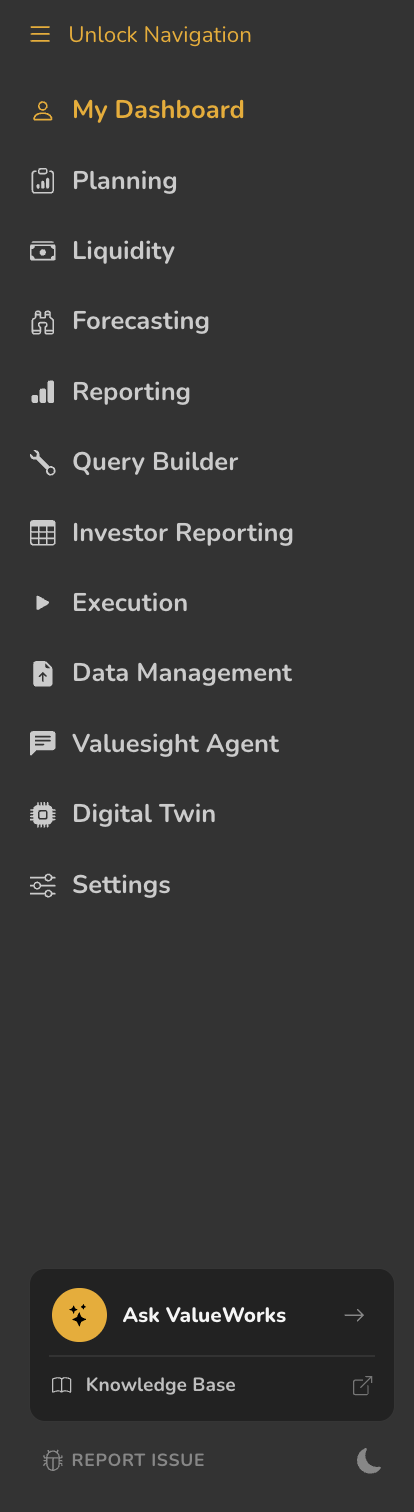
The ValueWorks left navigation listing twelve areas, with Ask ValueWorks and Knowledge Base at the bottom.

5. Both tiles show dashes. What is different about the second one?
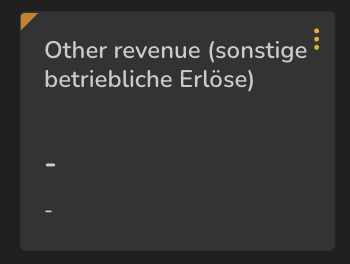
A KPI tile titled Other revenue showing dashes and no exclamation mark.
A KPI tile titled Number of new likes showing a red exclamation mark and dashes in place of a value and trend.

6. You explain a variance in a message to your manager instead of commenting on the KPI. What is lost?

7. A colleague says a KPI “appeared on their dashboard by itself”. Which tab are they looking at, and why?
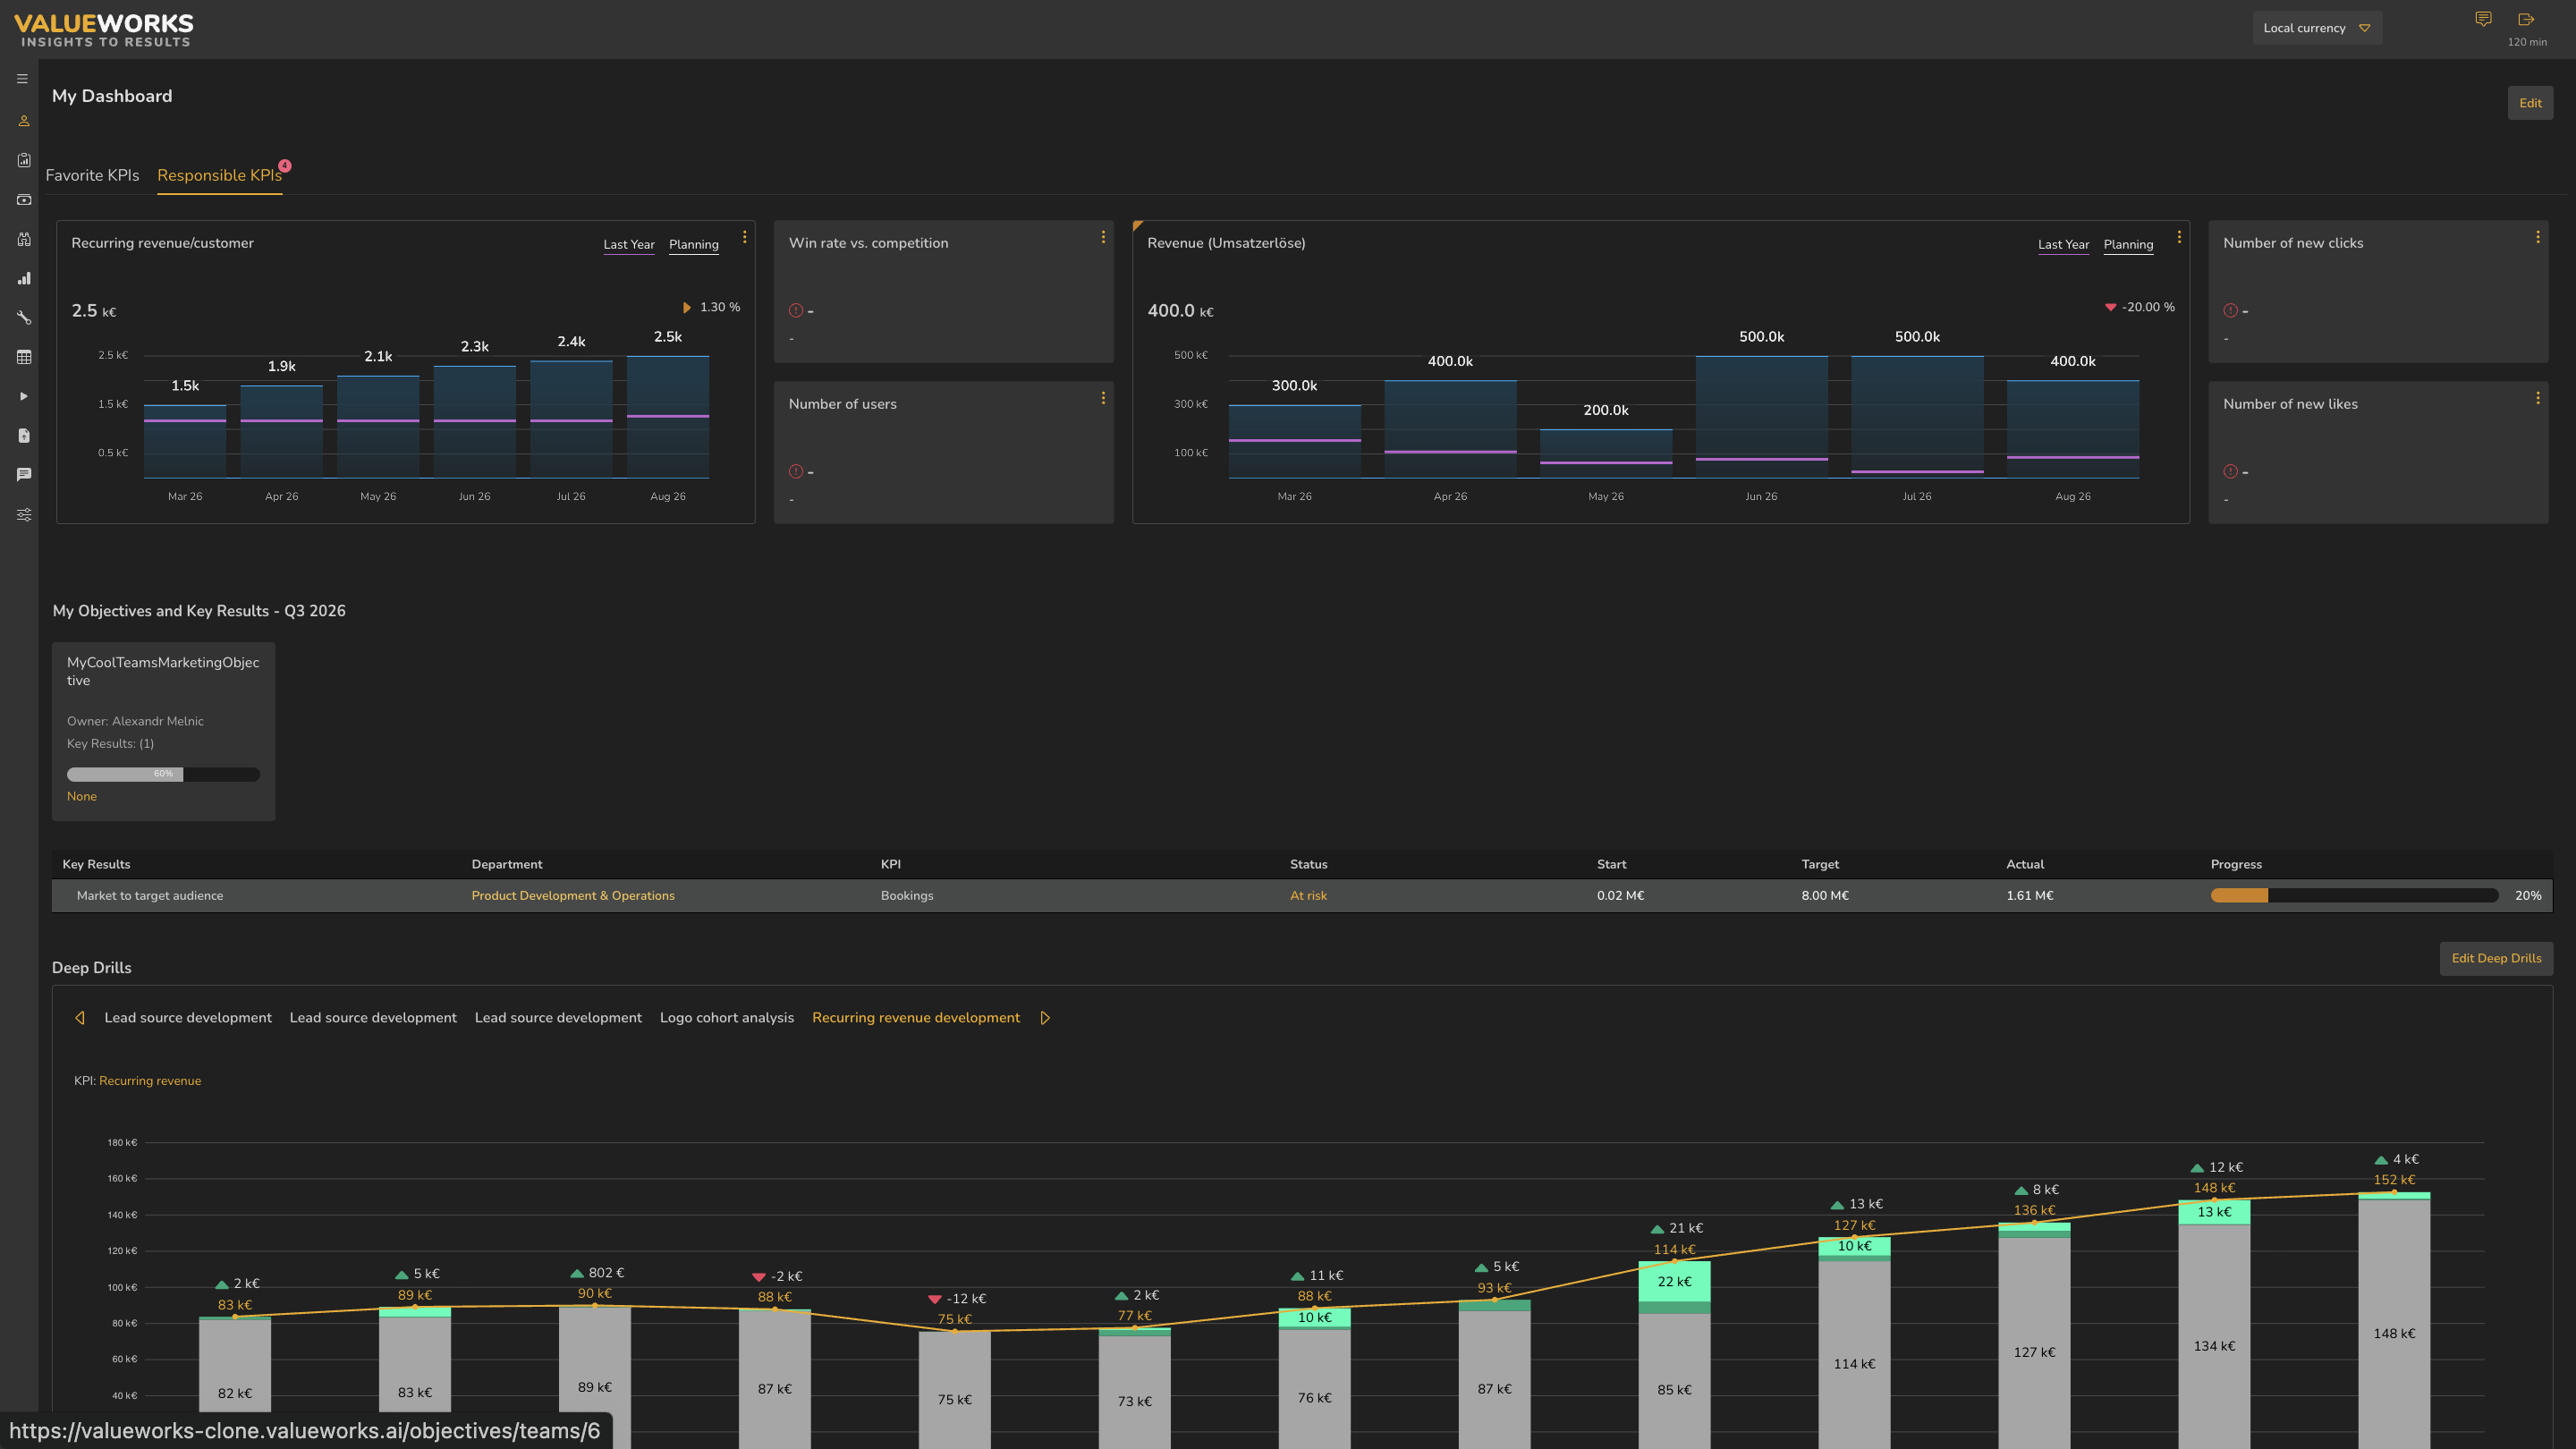
The Responsible KPIs tab showing a badge of four on the tab, KPI tiles, a My Objectives and Key Results section with an objective card and key results table, and the Deep Drills panel below.

8. Which pair is correctly matched?

The ValueWorks left navigation listing twelve areas, with Ask ValueWorks and Knowledge Base at the bottom.

9. What is the orange triangle in the top-left corner of this tile telling you?
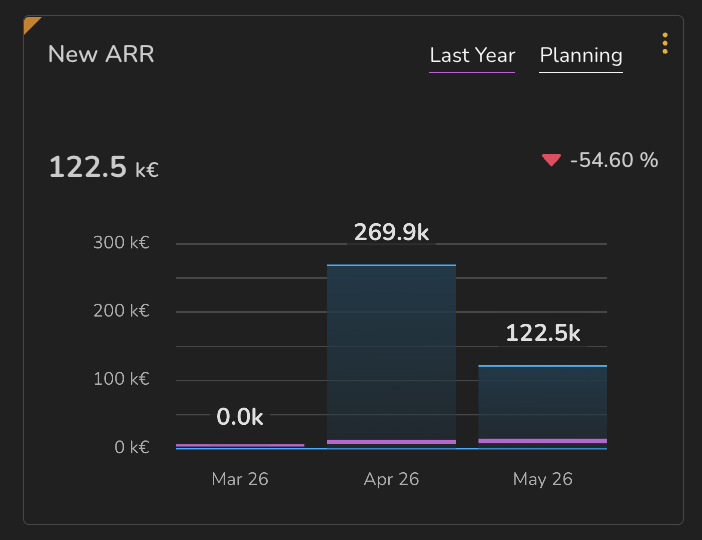
A KPI tile titled New ARR with an orange triangle in its top-left corner and a red downward trend of minus 54.60 percent.

10. Which indicator on this screen tells you a number may no longer reflect reality?
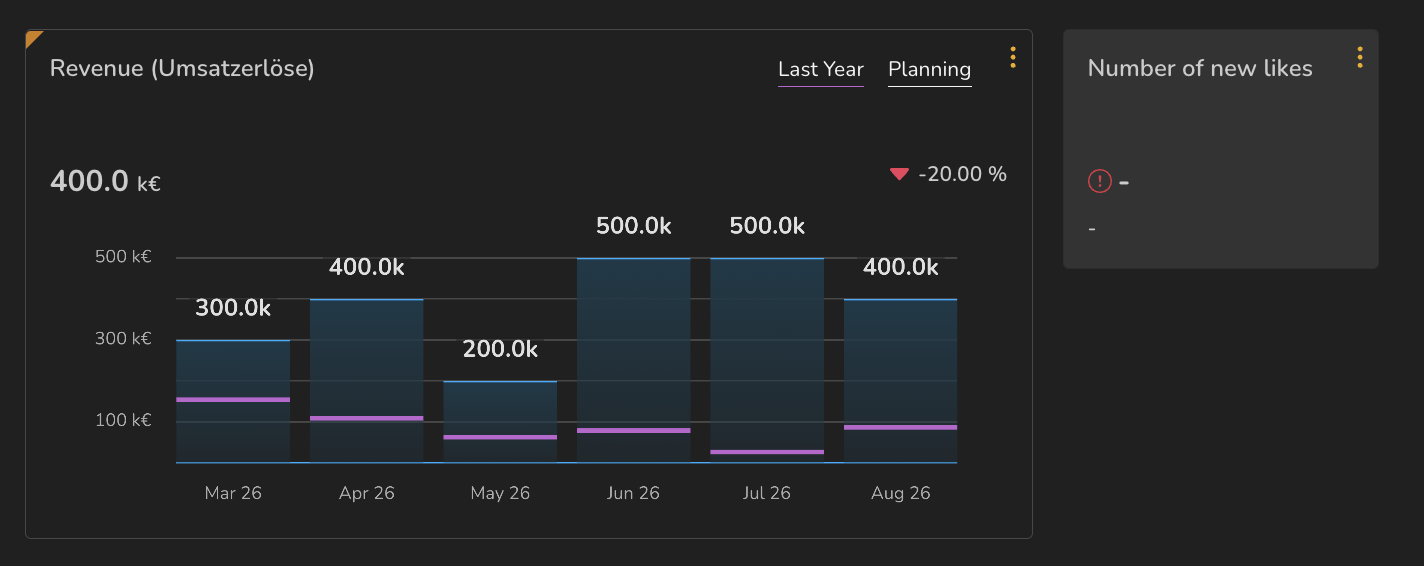
A Revenue tile with a full bar chart beside a smaller tile showing a red exclamation mark and dashes.

11. Both tiles show a downward triangle at −50%. Why is one green and one red?
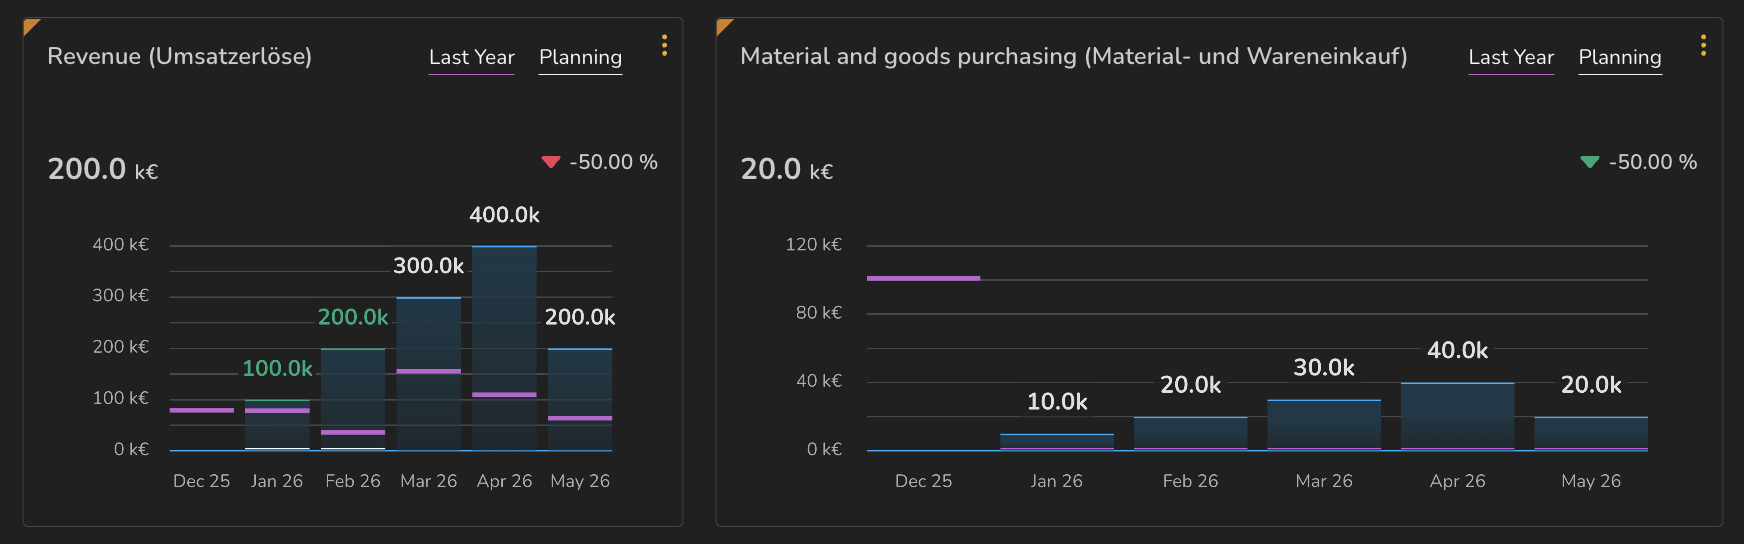
Two KPI tiles side by side. Revenue shows a red downward triangle at minus 50 percent. Material and goods purchasing shows a green downward triangle at the same minus 50 percent.

12. Recurring revenue/customer reads 2.1 k€. Someone asks whether that is the current month. What do you answer?
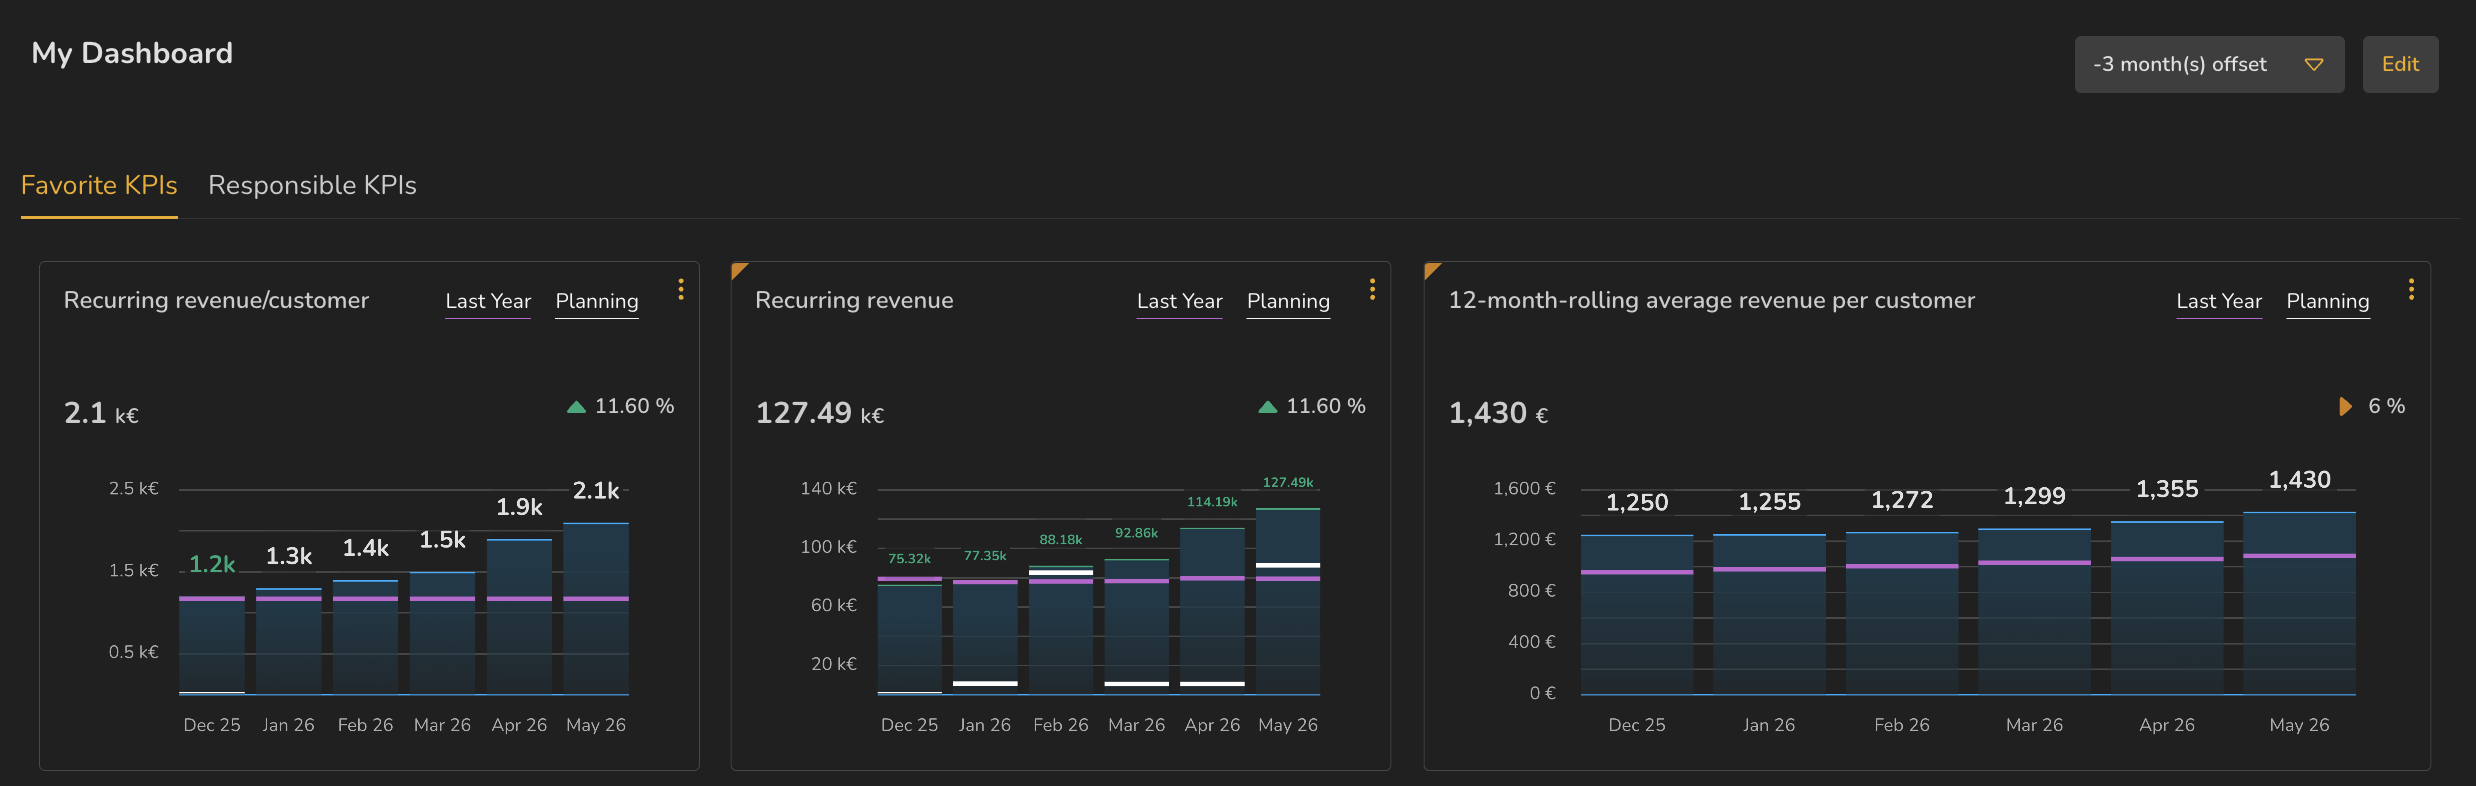
Three KPI tiles. Two show green upward triangles at 11.60 percent; the third shows an orange right-pointing triangle at 6 percent.