Reading the statement
Find your way around the Actual Overview table.
A P&L is a tree, not a list.
Revenue opens into revenue streams, and those open into individual products. The cost side works the same way. Every row you can open has children beneath it, and the figure you see is the roll-up of everything below.
After the period columns come five more: Total, Unit, CAGR, Formula and Action. Formula shows the row's measurement type — Σ for a summed KPI, Ø for an averaged one — the same value that appears as Measurement on the KPI's own Background tab.
A tab carrying an orange DRAFT badge is a structure still being built and not yet in use.
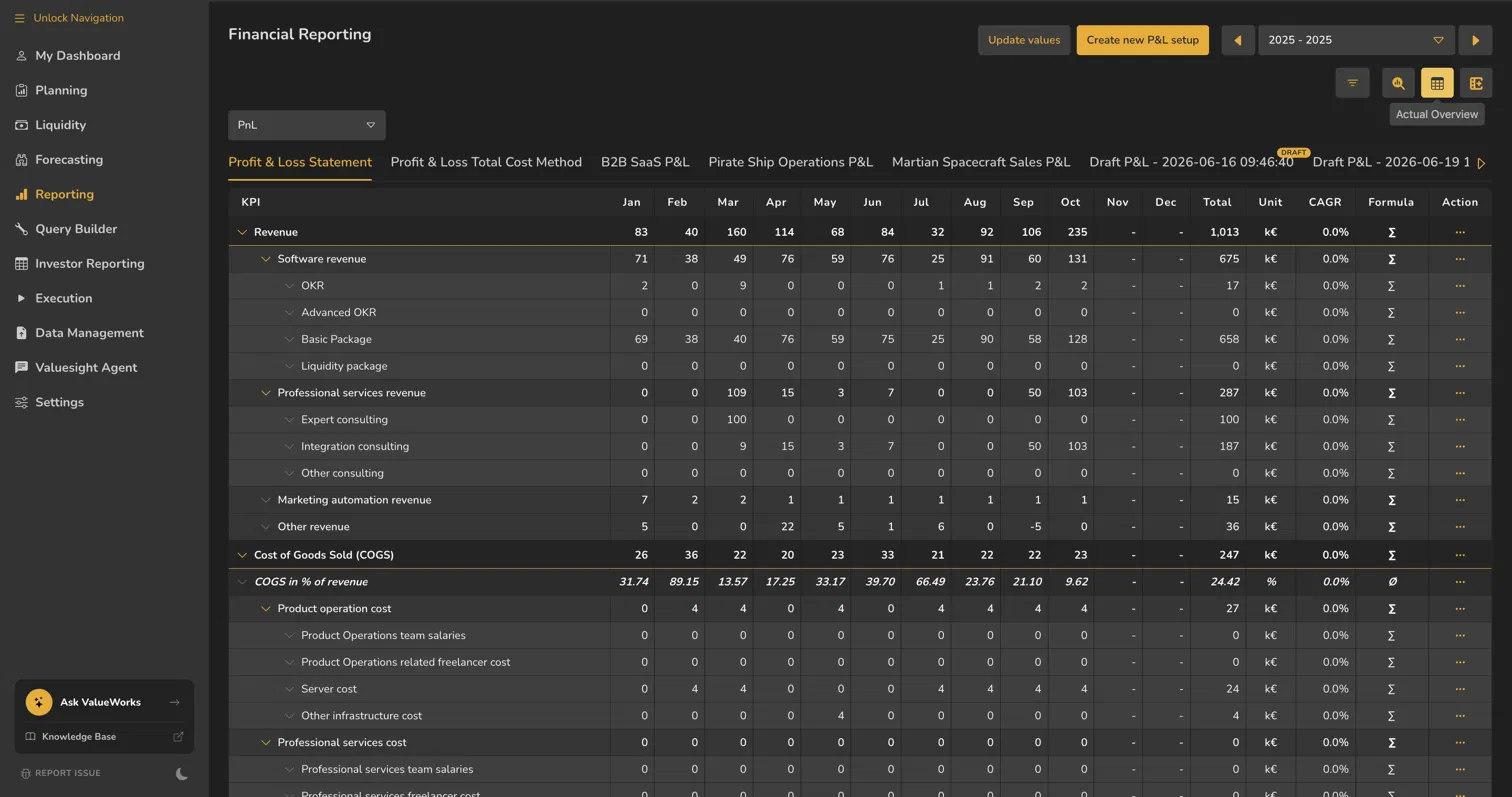
- 1PnL dropdown
- 2Statement tabs
- 3DRAFT badge
- 4Parent row and its children
- 5Total
- 6Formula showing Σ and Ø
ValueWorks 2026.08
Takeaways
Every openable row is a roll-up of the rows beneath it.
Formula shows measurement type — Σ summed, Ø averaged — matching Measurement on the KPI Background tab.
Statements are tabs; an orange DRAFT badge means the structure isn't finished.
Surfaces covered
- Reporting
- Financial Reporting
Also taught in the Academy
Module 2 · Financial Reporting
Take it as lesson 2.2 in Business Analyst & FP&A