Comparing with Planning, Last Year or Forecast
Choose the right comparison and read the result.
A number on its own says nothing. The comparison is the analysis.
Compare with in the options bar offers four choices: Planning, Last Year, Forecast and None. When you select Planning, Last Year or Forecast, the table adds that comparison alongside the current values and a Dev column. Deviation in switches the deviation between # and %.
Each comparison answers a different question. Planning — did we do what we said? Last Year — are we growing? Forecast — is our most recent view holding? None — the raw statement.
A line can be ahead of last year and behind plan at the same time. Both are true, so say which comparison you used.
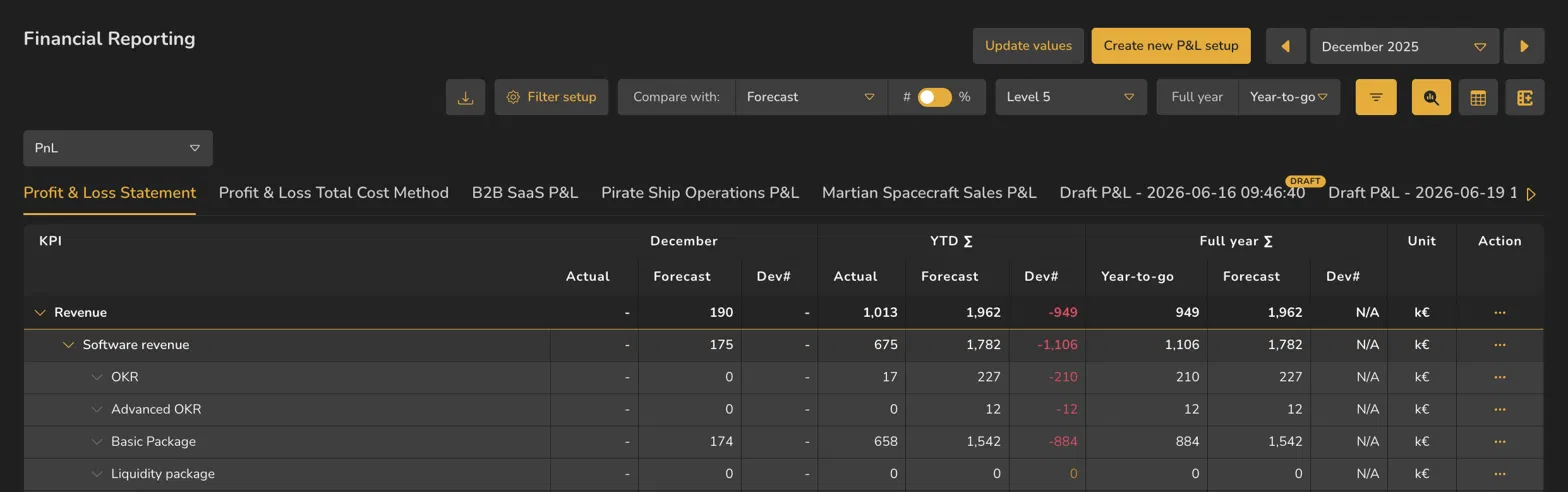
In Actual Overview, comparison columns repeat across the displayed periods, which can make the table wide. Actual Comparison condenses the view to the selected period plus YTD and Full year sections, rather than repeating the comparison across every month.
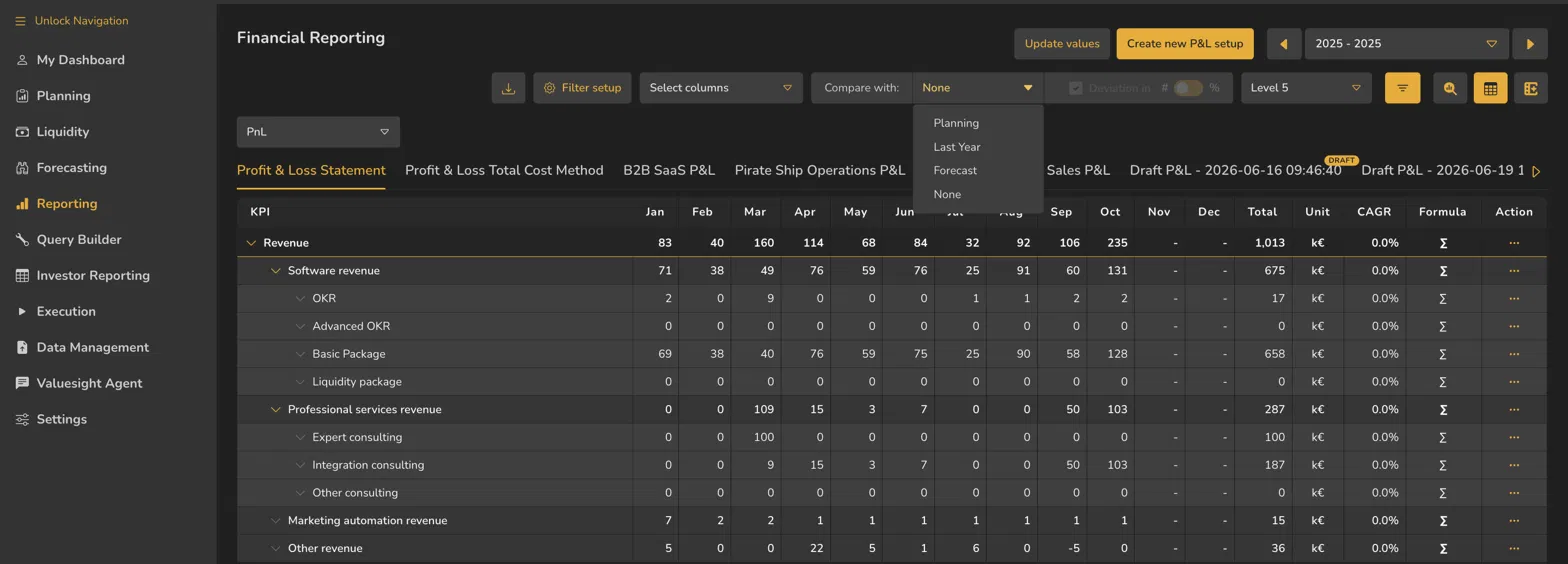
- 1Compare with
- 2The four comparison choices
- 3Deviation in # / %
- 4Greyed out while the comparison is None
ValueWorks 2026.08
Takeaways
Four comparison choices: Planning, Last Year, Forecast, None — each answers a different question.
Selecting Planning, Last Year or Forecast adds the chosen comparison and a Dev column; Dev can be shown as # or %.
Actual Comparison focuses on the selected period and keeps YTD and Full year summaries alongside it.
Surfaces covered
- Reporting
- Financial Reporting
Also taught in the Academy
Module 2 · Financial Reporting
Take it as lesson 2.4 in Business Analyst & FP&A