Building a P&L structure
Build a P&L structure without creating every KPI by hand.
A P&L is thirty or forty KPIs. Nobody should create them one at a time.
Create new P&L setup in the Financial Reporting header opens a draft. Drafts appear as tabs with an orange DRAFT badge and stay out of use until someone presses Complete. A draft can also be deleted outright.
An empty draft offers three routes. Generate via AI — pick a Table type (Profit & Loss, Balance Sheet, Cash Flow) and a Method (COGS or Total cost), which prefill an editable prompt. The prompt spells out the structure it will build, down to gross margin and EBITDA margin rows, and carries an [insert here] placeholder for your industry. Upload template imports a structure from a spreadsheet. + Add KPI builds it row by row.
⚠ Apply mode sits under the prompt. Replace existing — the default — overwrites every current row. Add to existing appends beneath them.
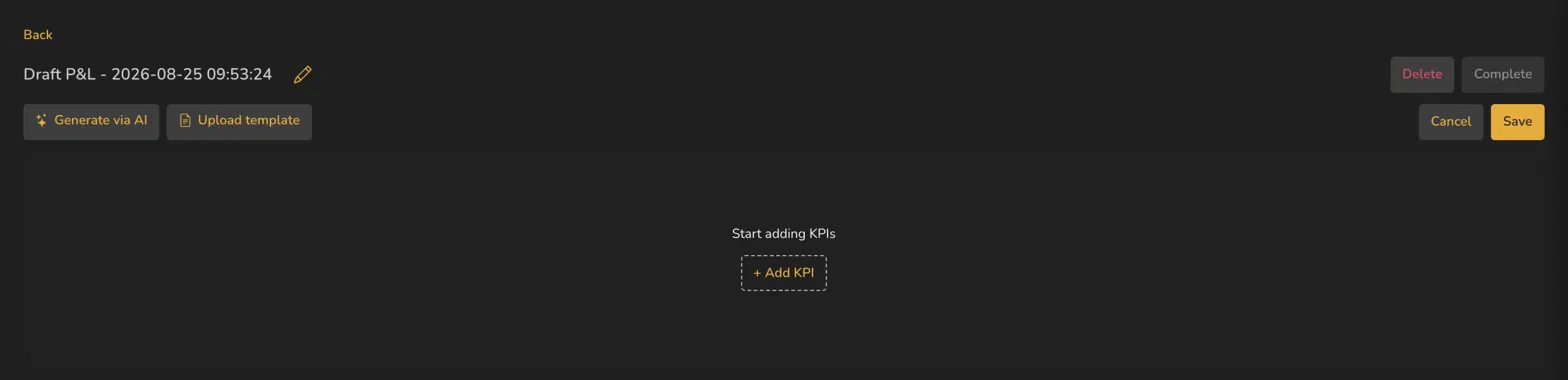
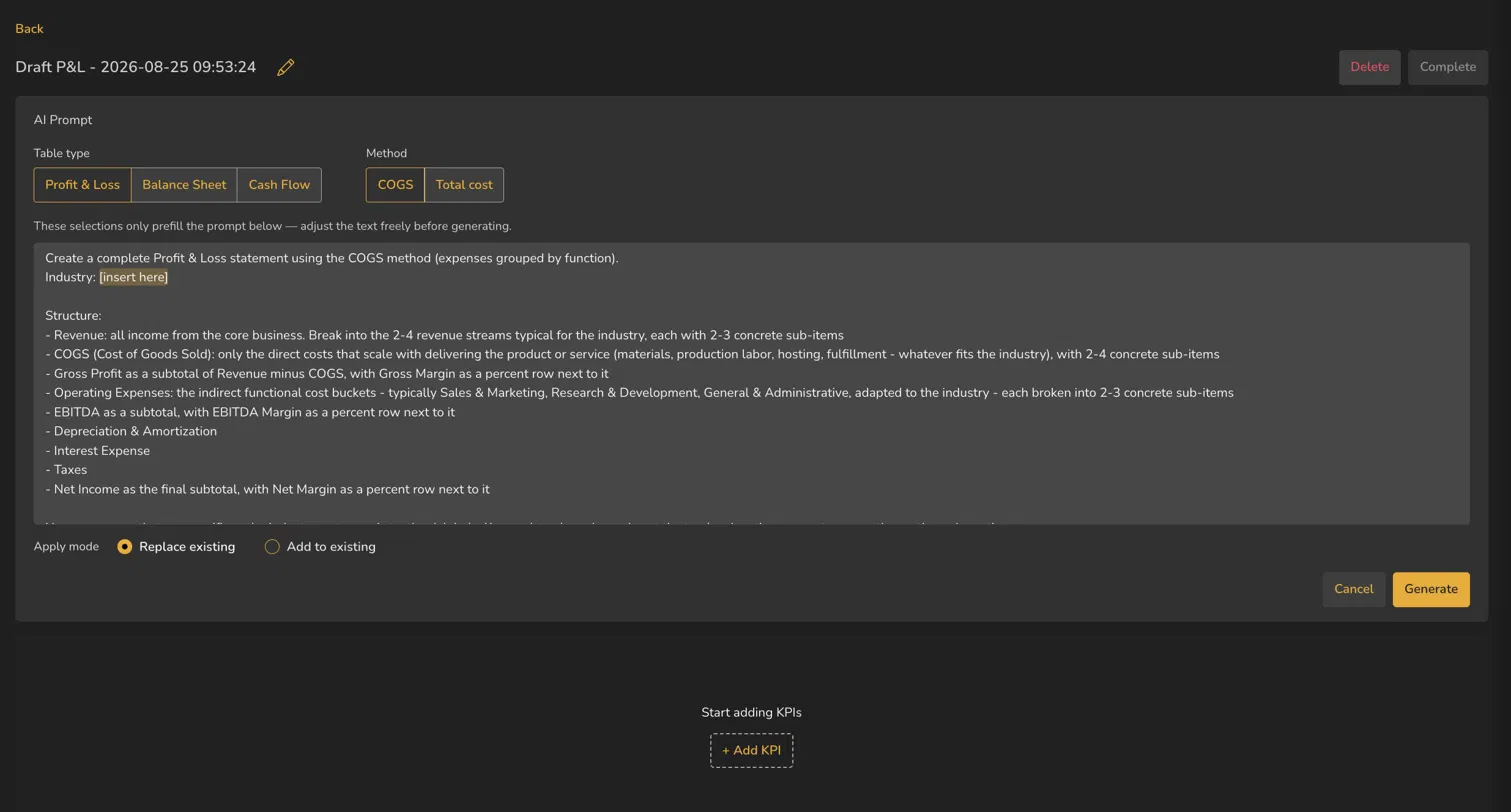
Try this in your tenant — open a new draft and look at the pre-filled AI prompt without generating anything. It tells you what structure the tool has in mind.
Takeaways
- ⚠ Caution
Create new P&L setup opens a draft. It only goes live when you press Complete.
Three routes: Generate via AI, Upload template, or + Add KPI. Table type and method only prefill the prompt — you can edit it freely.
⚠ Replace existing overwrites everything. Check the apply mode before you generate.
Surfaces covered
- Reporting
- Financial Reporting
- Query Builder
Also taught in the Academy
Module 2 · Financial Reporting
Take it as lesson 2.7 in Business Analyst & FP&A