Lesson 5 of 8 · 2 min
Level and margins
Control how much detail the statement shows.
The same statement can be one page or twenty.
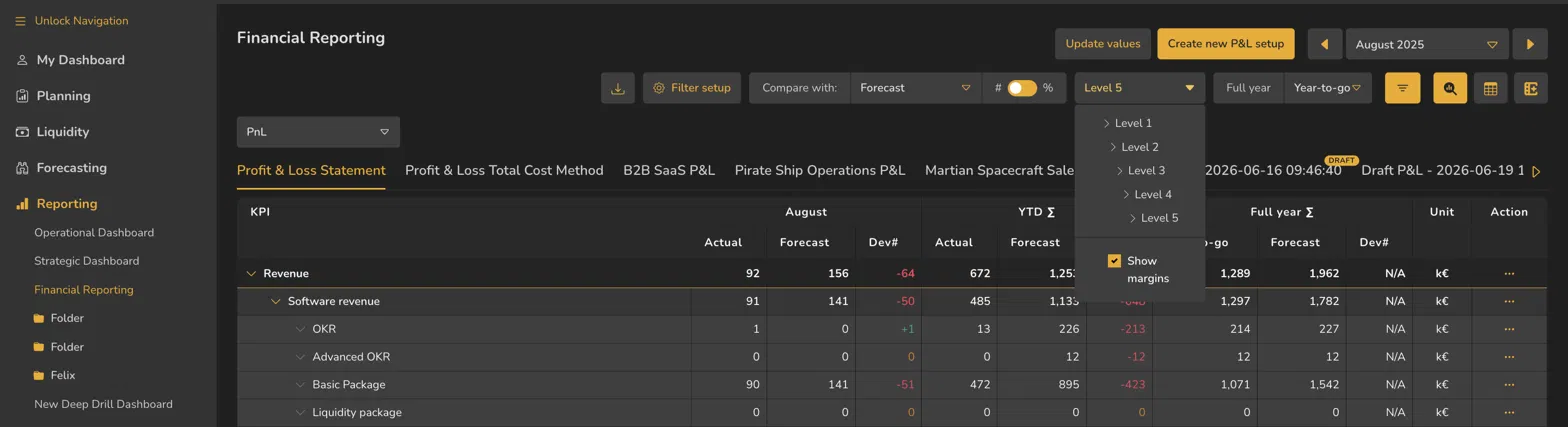
The Level dropdown opens the hierarchy to a chosen depth, everywhere at once — Level 1 through Level 5. It changes no number, only how many rows you see.
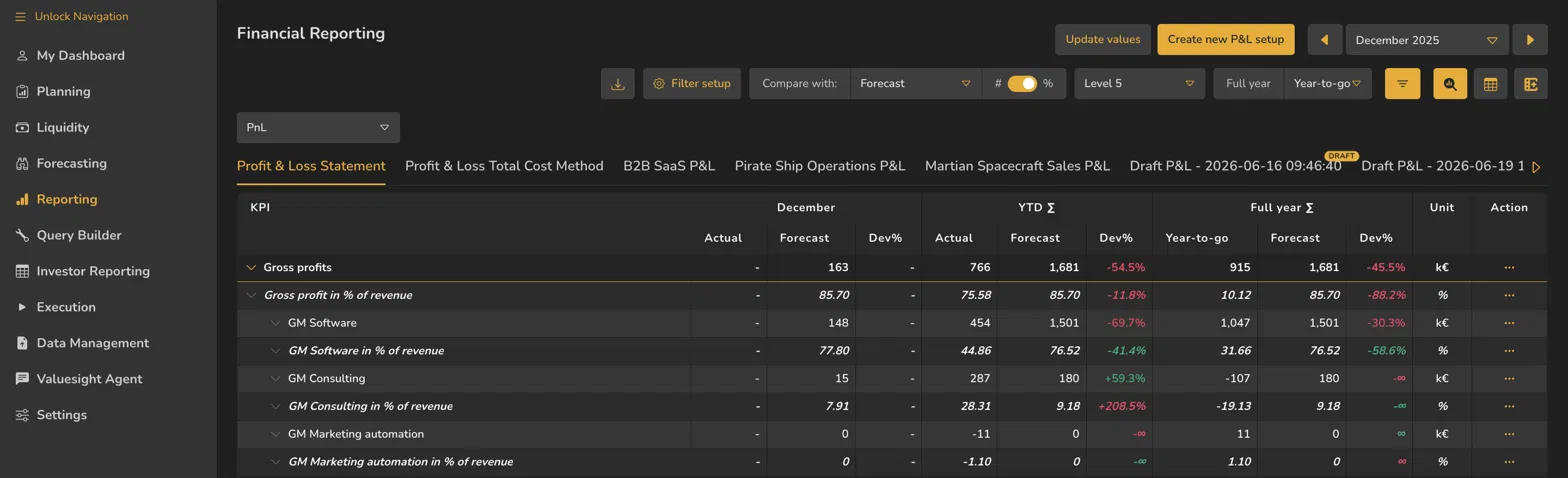
Show margins sits inside the same dropdown. Switching it on inserts percentage rows in italics beneath their absolute parents — Gross profit in % of revenue under Gross profits, G&A in % of revenue under General & administration.
Margins are what make two periods comparable when the business has grown between them. A cost that doubled in absolute terms may have fallen as a share of revenue, and only the margin row shows it.
The same Level control appears in Financial Planning, Operational Planning and table dashboards.
Takeaways
Level 1–5 opens the tree to a chosen depth — rows change, numbers don't.
Show margins lives in the same dropdown and adds italic percentage rows.
Margins are how you compare periods when the business has grown between them.
Surfaces covered
- Reporting
- Financial Reporting
- Planning
Micro-check
Two quick questions
Practice only — nothing here is scored or recorded.
1. You change Level from 1 to 3. What happens to the revenue total?
2. Where does the *Show margins* setting live?