Lesson 8 of 8 · 1 min
Operational and Strategic dashboards
Say what each standard dashboard is for and when to use it.
Three dashboards, three audiences, three review cadences.
The three standard dashboards differ by perspective and cadence, not by which numbers they can reach.
Financial Reporting follows the P&L structure, is reviewed monthly or quarterly, and mostly serves CFO and investor questions about financial health.
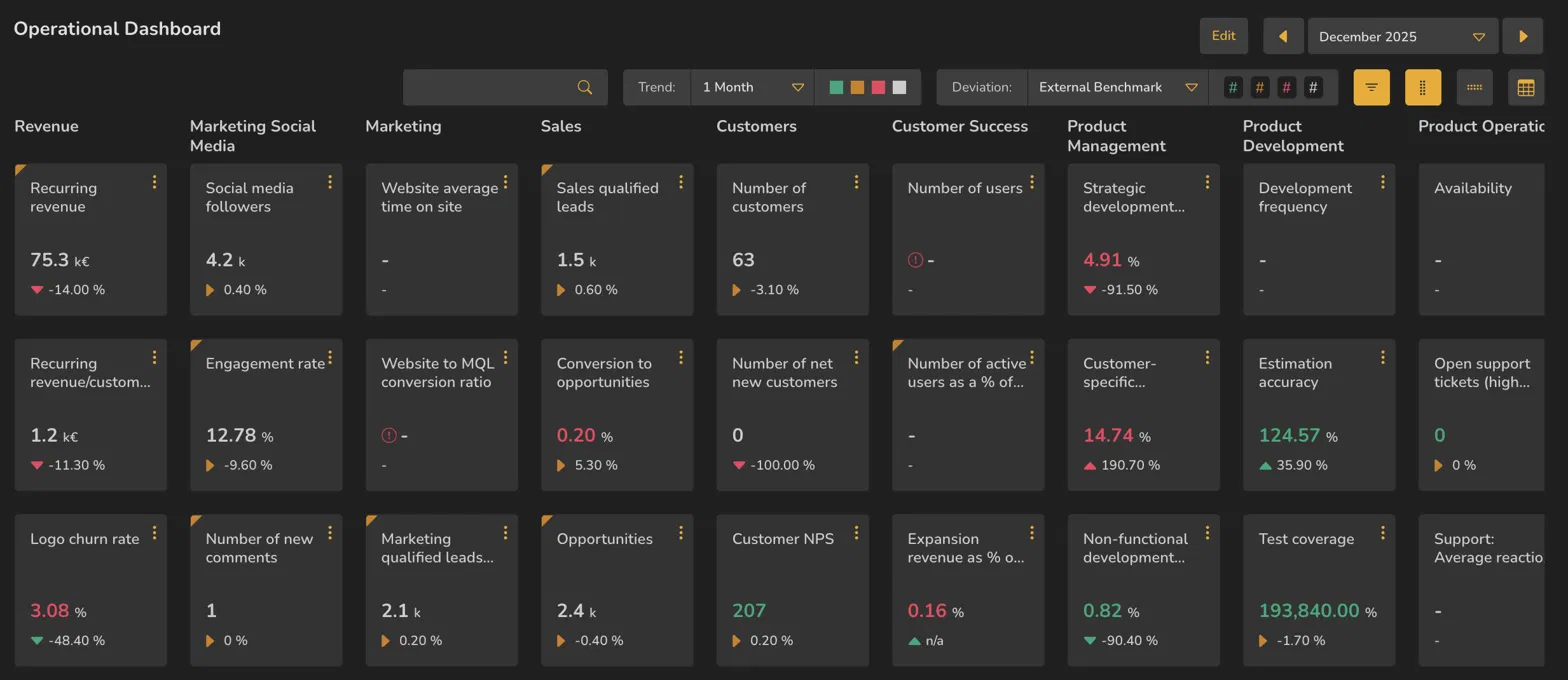
Operational Dashboard takes the customer and product process perspective and is updated weekly or monthly, so leadership can see how the organisation is running day to day. Its KPIs cover the main processes end to end: people as the input, customer and product processes in the middle, and deals, revenue and margin as the result.
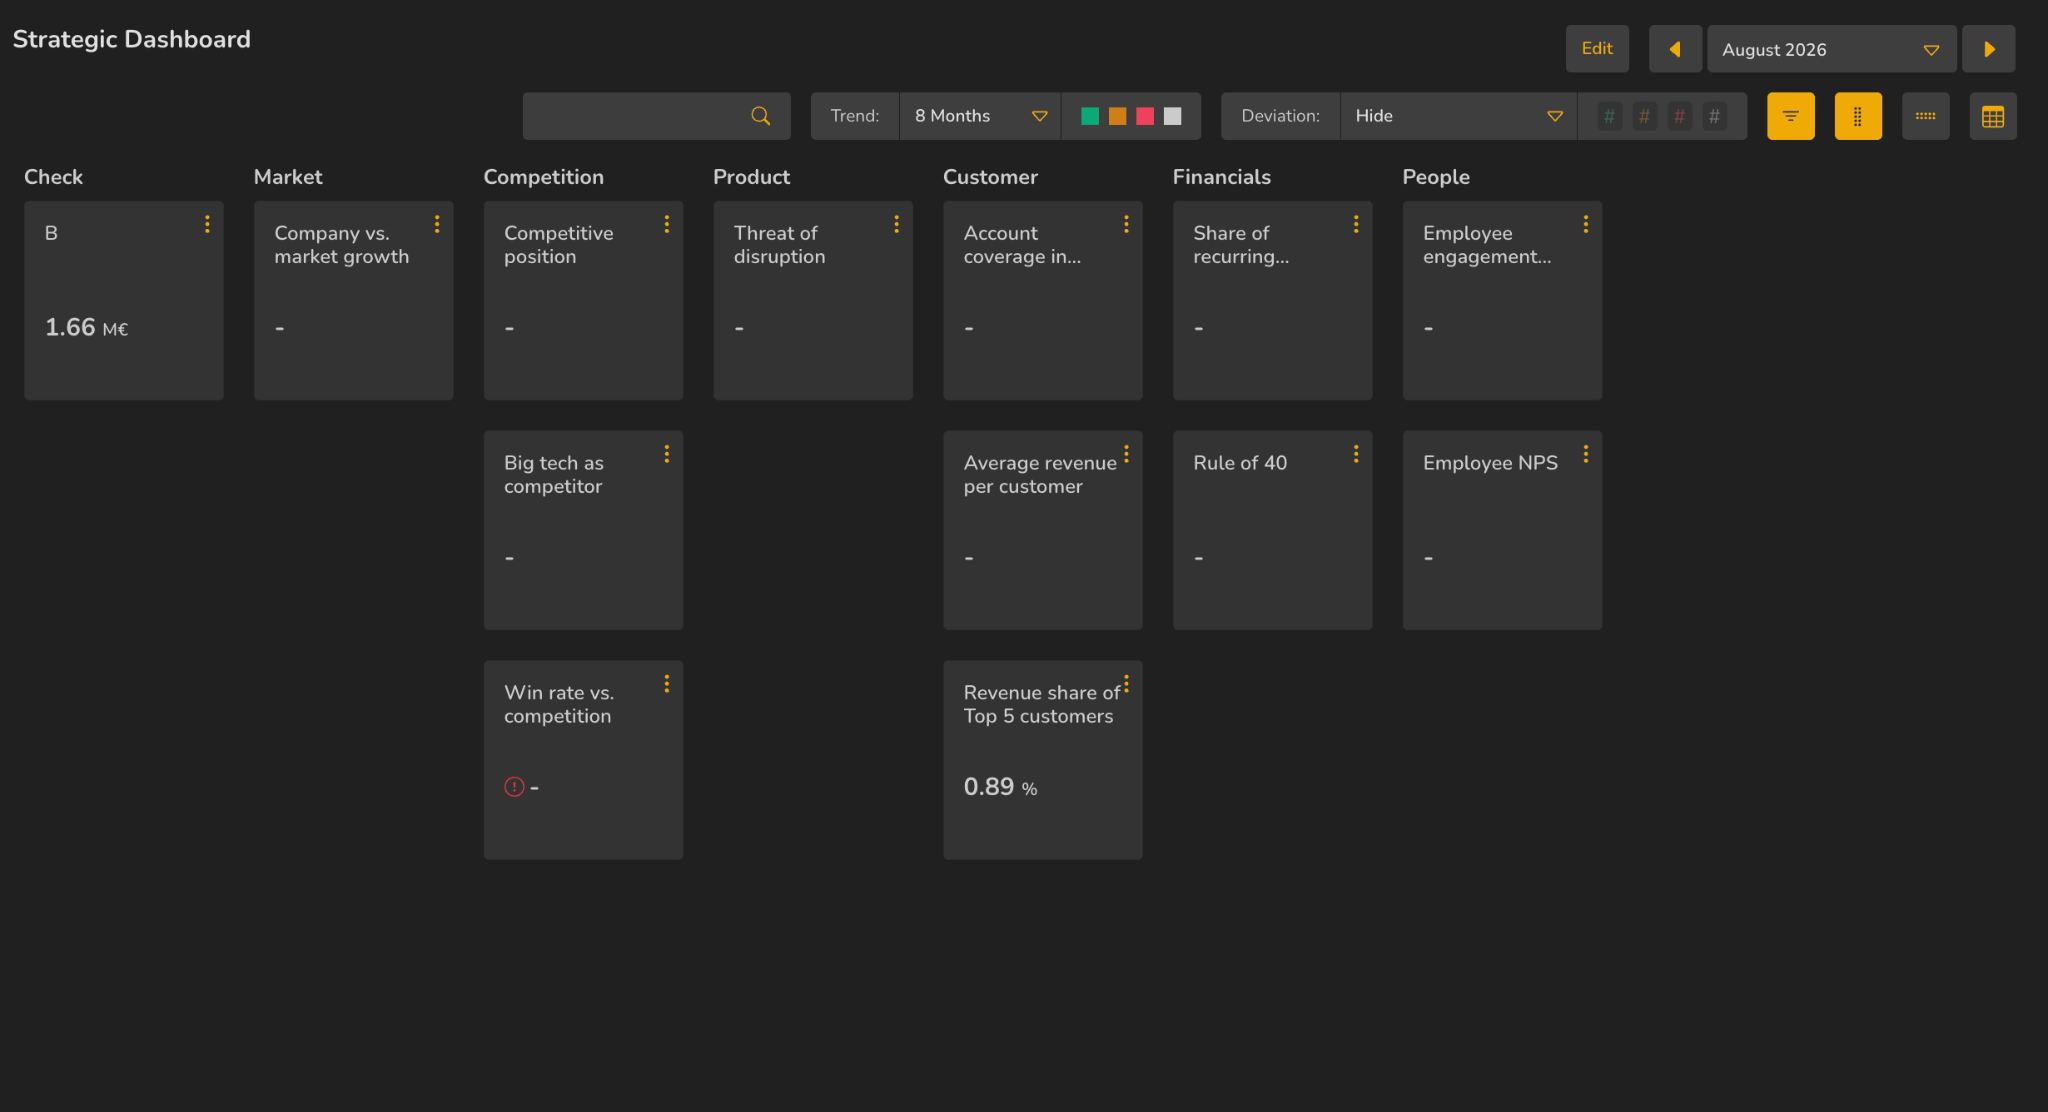
The Strategic Dashboard provides a consolidated overview of the company’s key performance indicators across core strategic areas, enabling users to quickly assess performance, trends, and potential areas requiring attention.
Both card dashboards offer a deviation filter and a trend filter, and switch between card and table view.
Takeaways
Financial — P&L structure, monthly or quarterly, CFO and investors.
Operational — customer and product processes, weekly or monthly, leadership.
They differ by perspective and cadence, not by what data they can reach.
Surfaces covered
- Reporting
- Operational Dashboard
- Strategic Dashboard
Micro-check
Two quick questions
Practice only — nothing here is scored or recorded.
1. Your COO wants a weekly view of how the customer funnel is running. Which dashboard?
2. What actually separates the three standard dashboards?