Lesson 1 of 10 · 3 min
The KPI detail page
Orient on the detail page and know what each tab is for.
Every number in ValueWorks has a page of its own.
The header carries the figures and the provenance together. Value and a period figure or two on the left; then Trend, Source, Responsible, Reporting Cadence, Last update and KPI Category.
The period figures change with the KPI. An averaged KPI reads Year to date Ø and 12 Months Ø; a cumulative one reads Year to date and Forecast. The Ø is the clue — it tells you the figure is a mean rather than a total.
Responsible and Reporting Cadence are dropdowns you can set from here. The bell icon opens alerts setup, and the heart adds the KPI to your favourites.
The tabs beneath vary by KPI. Trends charts it over time. List View shows the rows behind it. Charts holds saved breakdowns. KPI Background is the definition. Recommendations holds AI-generated suggestions.
Two more appear where they apply. Related KPIs shows the KPI's parent and the KPIs beneath it, each as its own chart, so you can see a family in one scroll. Deep Drills holds prepared analyses. A KPI with neither simply doesn't show those tabs.
The date navigation at the top right moves the whole page, tabs included. Comments sit at the bottom of every tab.
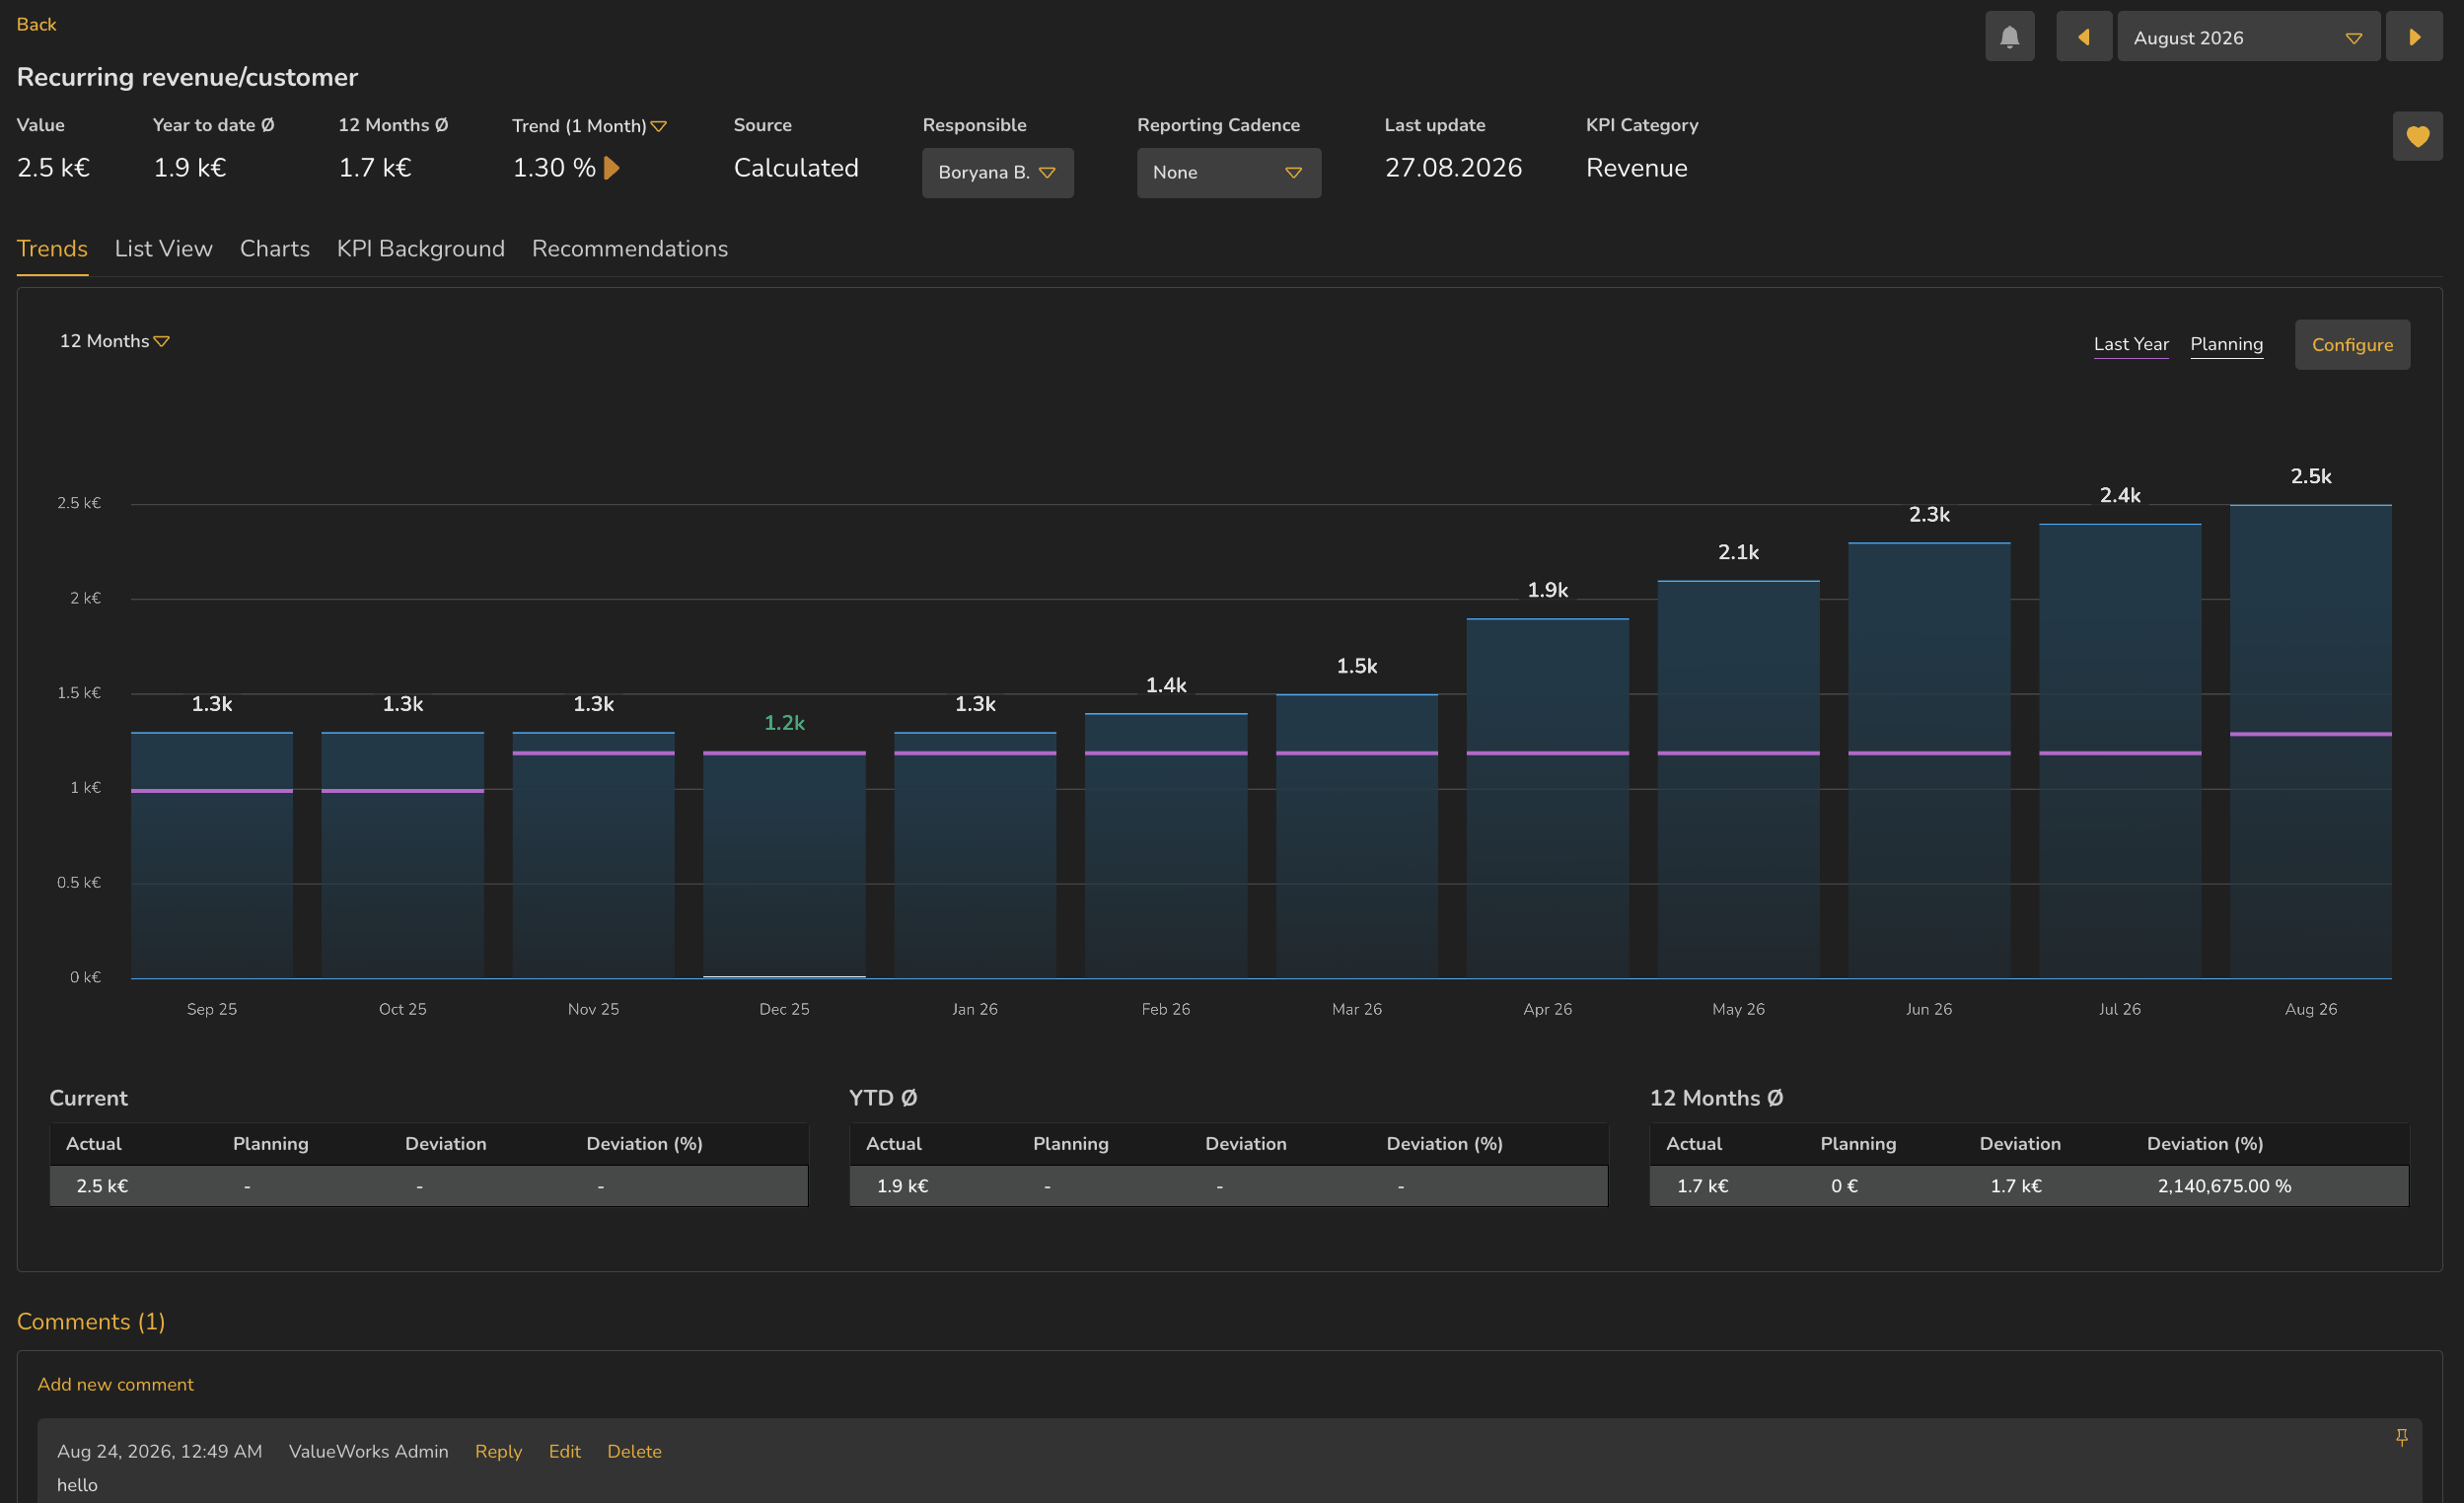
- 1Value, Year to date Ø, 12 Months Ø
- 2Source
- 3Responsible and Reporting Cadence
- 4Last update
- 5Alerts bell
- 6Favourite heart
- 7The tab row
- 8Current, YTD Ø and 12 Months Ø summary tables
ValueWorks 2026.08
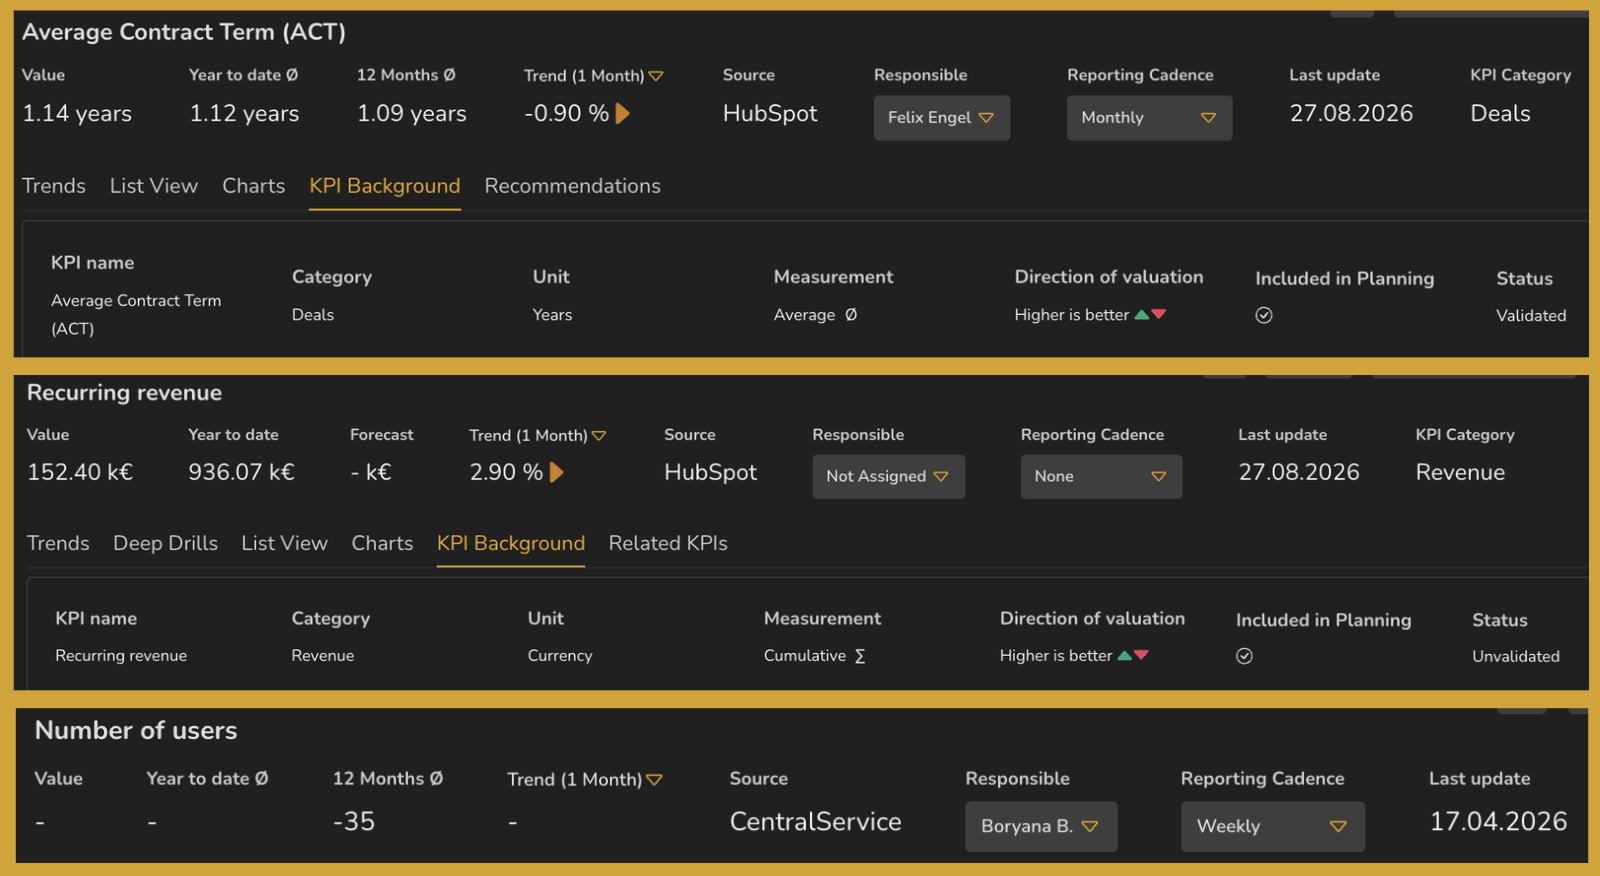
- 1Average Contract Term — named owner, Monthly cadence, Status **Validated**
- 2Recurring revenue — **Not Assigned**, cadence None, Status **Unvalidated**
- 3Number of users — owned and weekly, but Last update is **17.04.2026**
- 4The tab rows differ: only Recurring revenue carries Deep Drills and Related KPIs
ValueWorks 2026.08
Try this in your tenant — open a KPI you use often and check who is listed as responsible for it.
Takeaways
The header carries the figures and their provenance side by side.
Core tabs: Trends, List View, Charts, KPI Background, Recommendations.
Related KPIs and Deep Drills appear only where the KPI has them.
Changing the date changes every tab, not just the one you're on.
Surfaces covered
- Reporting
Micro-check
Two quick questions
Practice only — nothing here is scored or recorded.
1. You want to know who to ask about a KPI that looks wrong. Where do you look?
2. You change the month on the List View tab, then switch to Trends. What period does Trends show?